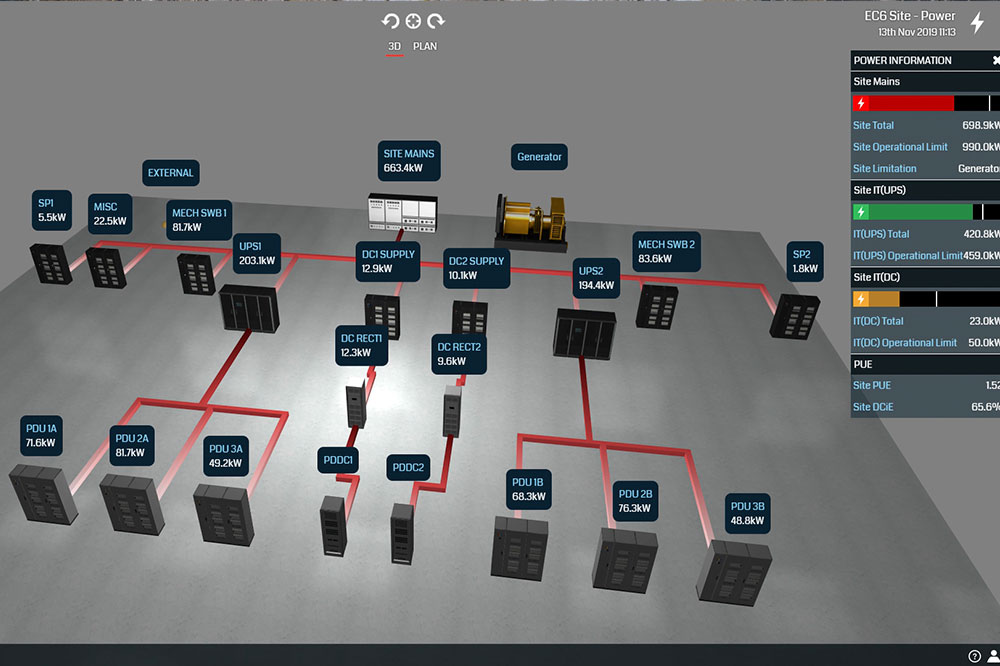
EkkoSense has launched a new software tool allowing data centre operators to get a 3D overview of how much power is being consumed within their data centre. The overview is delivered in real-time, allowing operators to address any issues with energy hogs or energy dropouts quickly and efficiently.
The new tool, dubbed Site Power View, is being launched as part of EkkoSense’s EkkoSoft Critical 6.0 software, which gives users real-time M&E capacity planning for data centre power, cooling and space requirements. With Site Power View users get an easy-to-use interface where they can navigate the power usage down to the device level, or get an overview of how much energy is being consumed by each room within the data centre. It also has the ability to offer the power usage across entire data centre estates, for those that manage multiple data centres.
“Site Power View directly addresses the requirement for real-time monitoring and planning of data centre power. Using a distinctive 3D power schematic visualisation it provides both data centre IT and facilities management teams with immediate insight into rack power usage and associated PDU utilisation across their estate,” explained EkkoSense’s head of product Management, Paul Milburn.
“With the new functionality our latest EkkoSoft Critical 6.0 release goes beyond traditional reporting to offer true capacity planning at a fraction of the cost of more expensive and complex traditional DCIM and BMS solutions.
“Previously data centre teams would have needed a combination of DCIM tools, outputs from their BMS, and multiple unwieldy spreadsheets to gain an understanding of power usage from a whole site perspective. Site Power View in EkkoSoft Critical 6.0 dramatically simplifies this entire process, with comprehensive power overlays and immersive 3D visualisations that not only display power usage, but also clearly show how power is being distributed and used from room to room. These full Site Power View schematics are critical for effective capacity planning, enabling smarter and faster capacity decisions across connected rooms.”
Site Power View’s 3D visualisations enable the creation of a series of Interactive Reports covering power usage, power usage breakdowns and power capacity across the entire data centre estate. Site Power View monitors both rack power usage and associated power distribution unit (PDU) utilisation and indicates spare power capacity where available. These cover:
- Power Usage – Total Power kW, IT Power kW, Cooling Power kW, PUE
- Power Usage Breakdown – Site Mains, IT (UPS) Power, IT (DC) Power, Cooling Power, Miscellaneous Power and other non-DC Power
- Power Capacity – Summary, Site Power Capacity, IT Power (UPS) and (DC) Limits, Capacity Overviews


