During 2020, Covid caused an absolute boom in our reliance on the internet, but with all our Netflix binging and working from home, how much did global internet capacity actually increase?
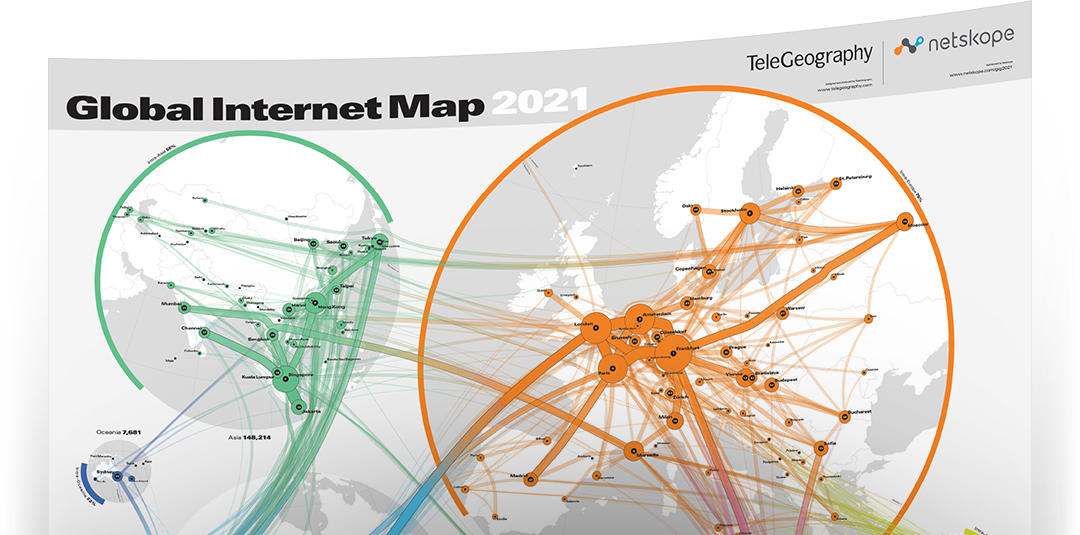
According toTeleGeography, between 2019 and 2020, international internet capacity grew by 35%, from around 450 Tbps to over 600 Tbps. Its 2021 Global Internet Map tracks global capacity, traffic, and pricing data, as well as a new cloud infrastructure section that puts the industry’s six major cloud providers on the map.
Sponsored by Netskope, TeleGeography’s 2021 Global Internet Map displays key insights into the world’s internet exchanges.
These include the aggregate number of exchanges in each country and the number deployed by region over the past five years. Key projections include intraregional internet bandwidth, metro-to-metro area internet bandwidth, metro area internet bandwidth and the top 50 metro areas ranked.
Anahí Rebatta, senior analyst at TeleGeography commented, “It’s been very interesting to track global trends in terms of capacity and traffic over the past year, and learning how operators responded to the pandemic.
“Our latest data shows that global capacity and internet traffic surged in 2020, mostly driven by the widespread remote work and learning, with more people relying on the internet than ever before.
“It’s a great feeling to release a new map and share all of these insights with the industry. And this year we’re layering in even more cloud infrastructure data, including six new cloud service provider maps showing active and planned cloud regions, number of availability zones, and on-ramps.”
The map reveals key insights that include:
Regional capacity: Europe is the region with the highest regional capacity, and has also seen the largest growth from 2019 to 2020.
Global peak traffic: Peak international internet traffic increased at a compound annual rate of 30% between 2016 and 2020.
Global average traffic: Average international internet traffic increased from around 120 Tbps to 170 Tbps from 2019 to 2020.
Covid-19 impact: The peak traffic growth rate for 2019 to 2020 was forecasted at 28%, however the observed level for the same period was much higher, at 47%.
Joe DePalo, SVP of Platform Engineering at Netskope added, “Netskope is proud to support TeleGeography’s 2021 Global Internet Map.
“We believe a secure and safe internet supports long-term growth and innovation. The disruptions the world saw in 2020 showed the mission-critical nature of the internet and the value it delivers to both businesses and people.”
“Visibility and insights are vital components of any digital transformation journey, and through the sponsorship of this map we aim to help more businesses respond to global trends and secure their networks.”
The map is available as both an online interactive version or a physical version to hang on the wall or take to meetings. View the interactive map here.